Case Study: A Vision for SAP Analytics
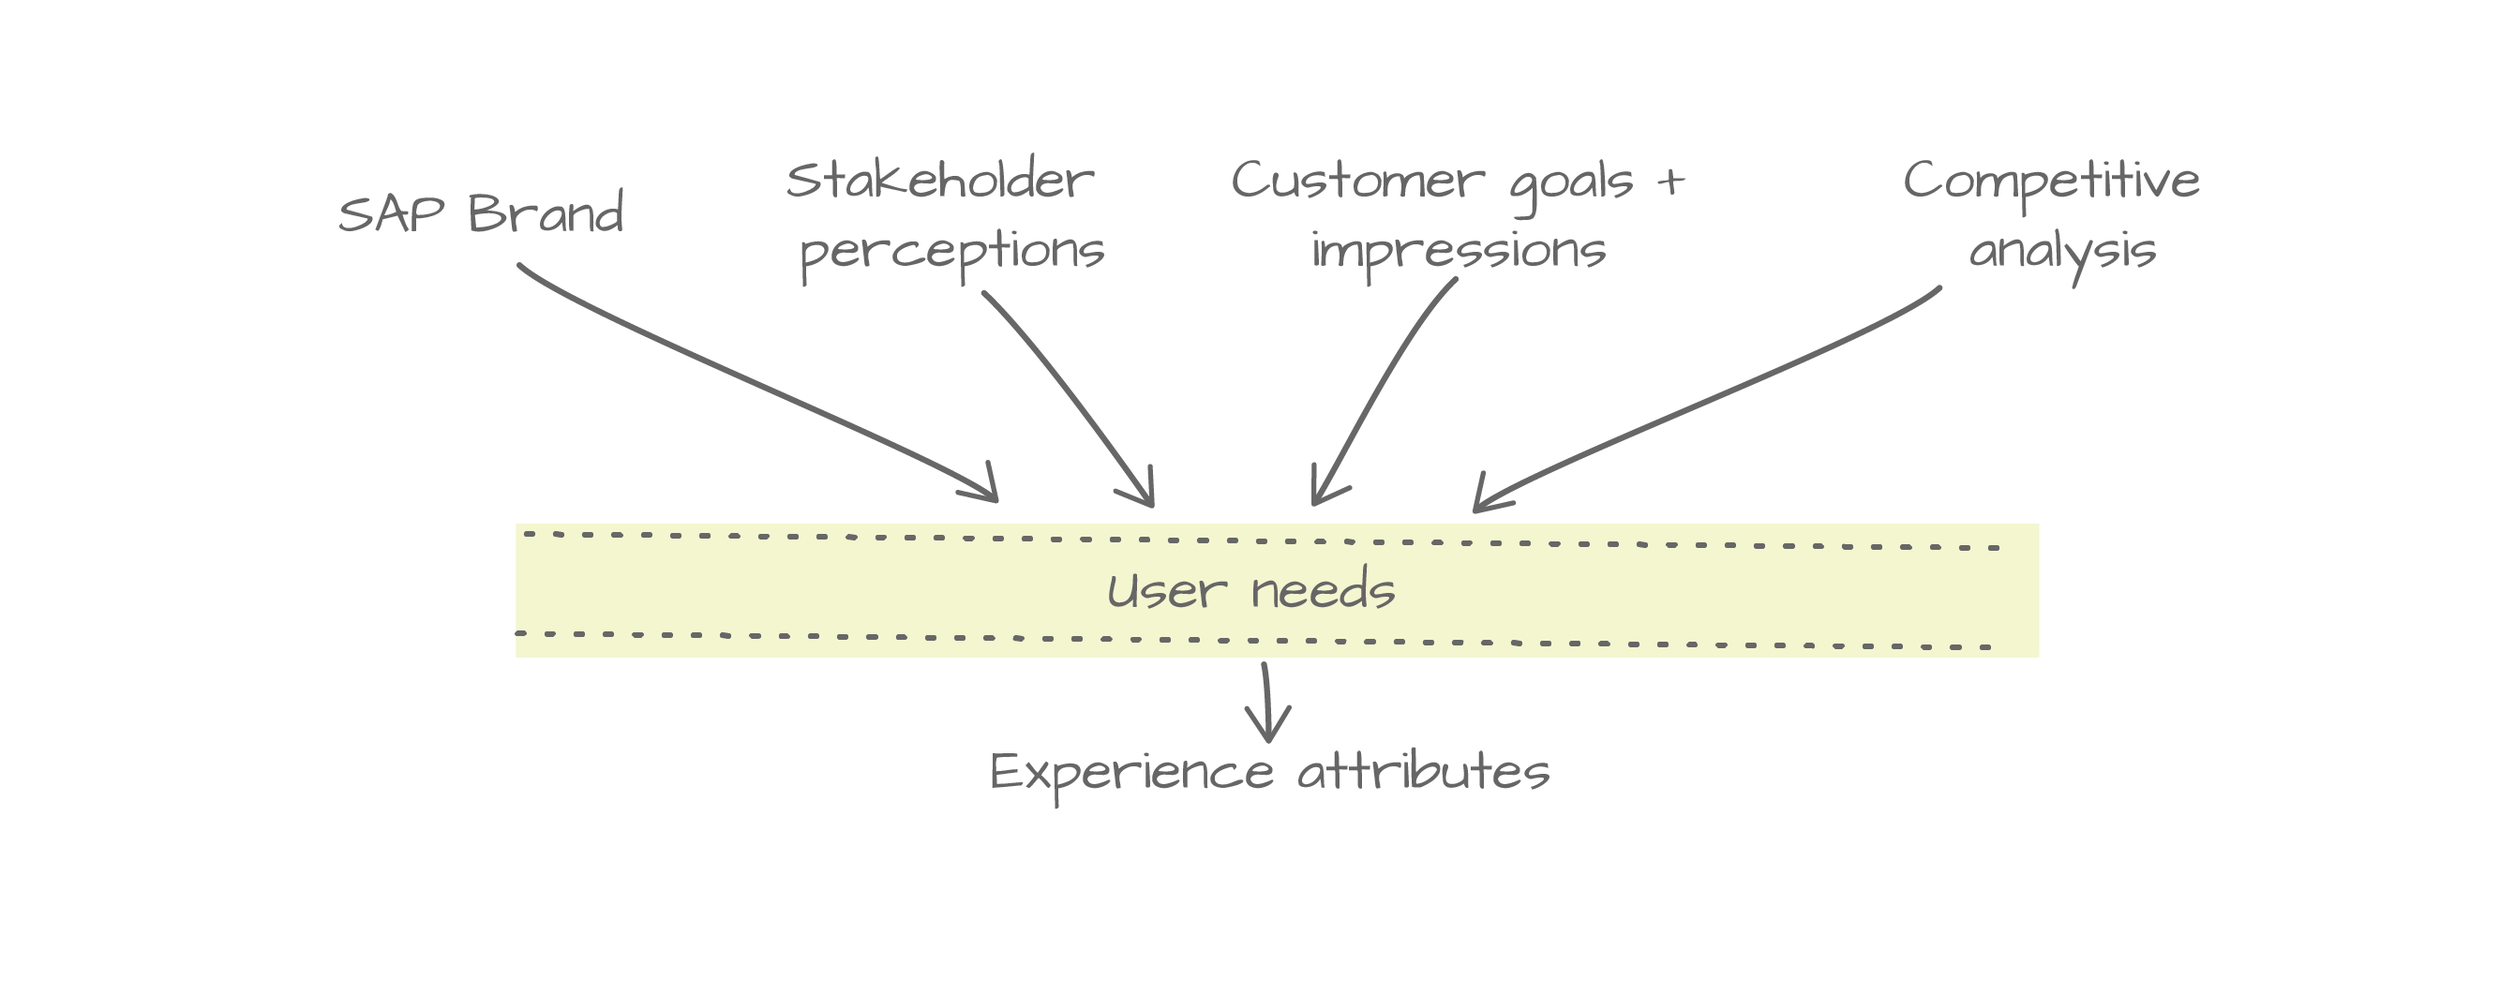
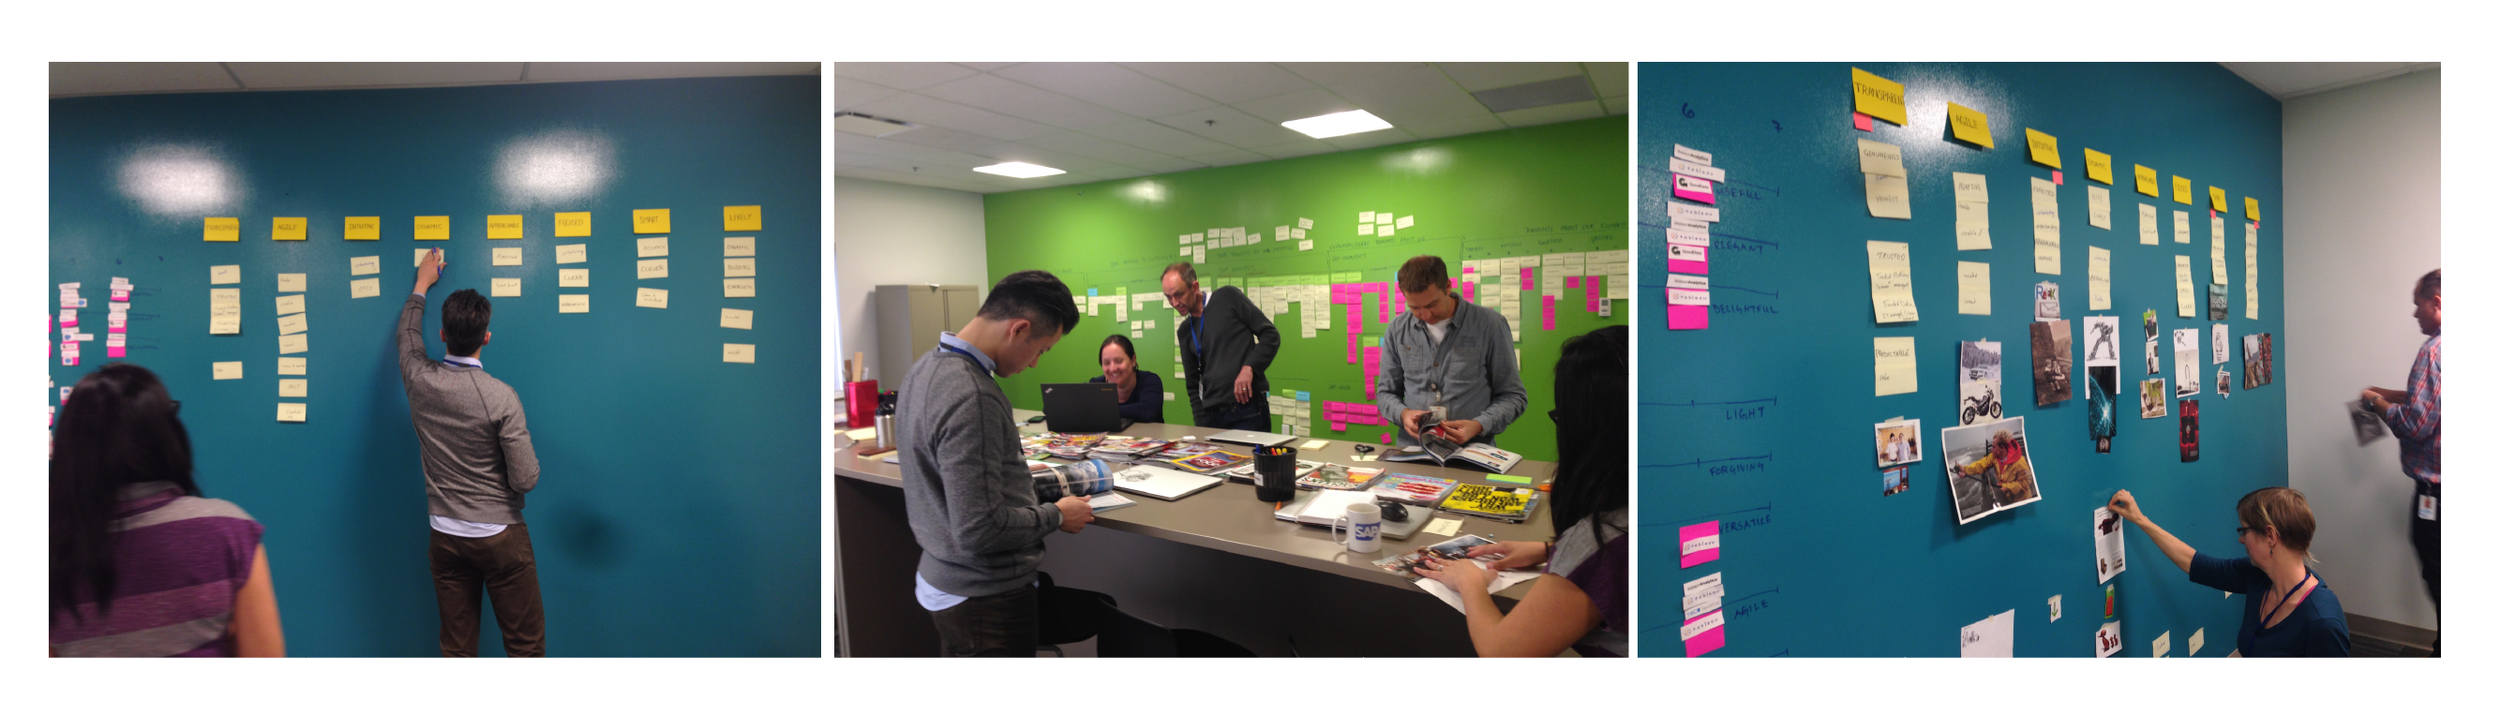
Here are the steps we took to engage stakeholders from across the business to arrive at a UX strategy.
Experience attributes
We used experience attributes to define our product "experience". These attributes would be the cornerstones, driving discussions on strategy.
A workshop was important for buy-in
We conducted a workshop with key stakeholders to understand their views, align on the attributes, as well as gain buy-in to our process. People from across the business — sales, marketing, product managers, and development leads — participated.
Our final four attributes
These are the four experience attributes we arrived at in the workshop. They're plotted on a matrix to show how they can relate to one another. Supporting words in a lighter colour clarify meanings for everyone involved. The "sweet spot" of our experience is in the middle: we're adaptable and current, we're trusted and honest, we're approachable and open, we're lively and fun.
Mood boards
After the workshop, I developed mood boards, to begin arriving at visual representations of our product experience.
"Style" Tiles
These little tiles hint at UI but are still only early explorations based on the mood boards and design principles we developed. The colours and their proportions to each other here try to show the "lively" and "adaptability" ends of our experience matrix.
Framework
The attributes informed the application framework as well. We knew from earlier user studies (extensive onsite interviews) that our users love Microsoft Excel. Because our experience focuses on "approachability" and "trust", the object model for our product is similar to Excel. We used this diagram to explain the structure of the application framework to our stakeholders: toolbar at top, contextual controls at right, a working page that can hold any number of data-related artifacts.
Pages
Like Excel, our framework has any number of pages. Unlike Excel, functionality specific to creating data analyses is available in a persistent toolbar and contextual panels.
One document
All data artifacts and pages can be saved and shared as one document. So, our experience is in a "trusted" form but with "adaptable" functionality.
Log-in
Log-in, or a place of welcome. A user has the option of customizing the background imagery making it feel more "approachable."
Home
Home, a place where the user can organize and customize widgets. It's not only a launching point. It's a place where collaboration and conversation happens. Subtle animations and small hits of bright colour add to the "lively" feeling.
Documents
Everything a user makes or has access to is here, defaulting to when they're made. Avatars show who the author is and whether they're online for easier collaboration.
A "trusted" form in a "lively" skin
The document space as described earlier in the framework diagrams. The toolbar at top persists. The panel at right changes, surfacing functionality based on user selection.
"Trusted" functionality
Conditional formatting is a tool our persona knows and loves. In "PEP", she can access it with the added power of connecting to complex data sources.
Interactions and animation
Each screen in this video maps to a detailed scenario for our persona. I can't however share any information on the scenarios or the persona due to a non-disclosure agreement with SAP. Please do enjoy some snapshots from our final video presentation.